| Magyar |
| Menu |
| Home |
| More |
| Contact |
| References |
| 100MS/s DSO |
| DigiCam8 |
| Arthur-PC |
| USB-s programmer |
| Scoreboards |
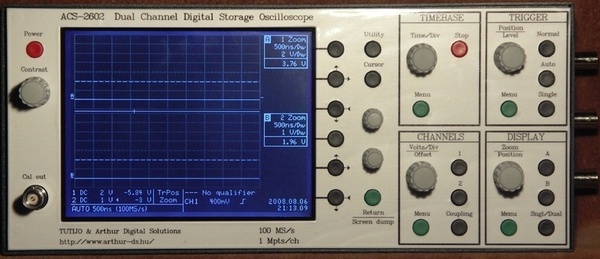
ACS-2602 - 100MS/s Digital Storage Oscilloscope
We made this equipment with a friend of mine. It was his idea, although I also had been thinking about building a scope for a long time. I told my buddy that if he designed the analogue part, I would do the rest. Well, Feri came up with a couple of analogue circuits which worked, so I kept my word and the design commenced.
Initially the target was a simple unit, but then we agreed that if we
did it, we should do it properly. A short quote from Wikipedia seems
fitting:
"Digital scopes rely on effective use of the installed memory and trigger
functions: not enough memory and the user will miss the events they want
to examine; if the scope has a large memory but does not trigger as desired,
the user will have difficulty finding the event..."
After some musing the fundamental requirements took shape:
- 2 channels + external triggering
- 100 MS/s on both channels
- 1 MS storage per channel
- Special trigger functions
- Peak-detect (min-max) storage mode
- 5mV...5V / DIV sensitivity (AC/DC)
- 320x240 monochrome LCD
- SD/MMC card
- User interface with real knobs
I believe that a good scope's trigger circuitry should offer more than the simple edge trigger. That's especially important when testing digital circuits. Therefore, I put emphasis on the triggering. The modes realised in the scope cater for rather flexible triggering.
Withe edge and dropout modes you can select positive and negative edges as well as any edge. In edge mode the holdoff can be specified by time or by the number of events to be skipped. In pulse and interval modes four different time conditions can be selected.
|
|
In video mode the triggering happens at the given line number. For PAL vide signal you can specify which line of which field of the frame you want to trigger on. If your input is a non-standard video signal, for example old computers' video out, you can still specify a line number but naturally field selection is not possible.
|
|
The two input channels have separate A/D converters, storage control and memory. The A/D converters always operate at 100 MS/s.
At 100 MS/s the 1 MS memory can store 10ms worth of samples. If you need to store more than that, you have to drop the sampling rate. The simplest solution is to store every N-th sample while discarding all intermediate ones. The disadvantage of that approach is that you might lose short events that happen between the two stored sample points. To avoid the loss of small detail you can select the min-max peak-detect mode. The A/D converter will run at full speed but intermediate samples are not discareded. Rather, the smallest and largest sample values are sought and that pair is stored for the N sample interval in two consecutive sample locations. Consequently, only 500KS can be stored per channel, but a 10ns long spike will remain visible even at the lowest sample rate.
|
This menu is for the vertical settings:
|
Here you can select the attenuation of the probes so that the displayed values correspond to actual voltages. Often used sensitivity and offset value pairs can be stored as fast selectable favourites. Naturally, the input coupling, offset and sensitivity can be set using dedicated knobs, you don't have to go to the menu for that.
The measurement result is worthless if you can't examine it in detail. Thus, a fast and flexible display is also very important. The displaying of the 1 MS on the 250 pixel wide screen is done by hardware which is capable of drawing 20~30 full screens per second. The two curves on the screen do not necessarily show the two channels, so they are called curve A and B instead. Both can display any channel, the inverse of any channel or the difference of the two channels, which is very important when monitoring differencial signals. Furthermore, both curves can have a zoom function enabled.
|
|
The two curves can be drawn on a common grid or on two separate grids. When using a single grid, the curve intensity difference helps visually identifying the individual traces.
|
|
It is possible to use amplitude or time cursors. Both can be relative or absolute. In relative mode there are two cursors and the difference between their time or amplitide is displayed. In case of absolute cursors, the absolute voltage or the absolute time since the trigger is displayed. When using time cursors, not only the time and frequency values are shown, but the voltage corresponding to the cursor position is also displayed.
|
|
The utility menu contains many useful functions. Among other things, the grid intensity can be set here, or inverse video can be selected.
|
|
The frequency of the calibration output can be set between 2Hz and 1MHz with a variable duty cycle between 10% and 90%. It is also possible to route the trigger to the calibration output; that can be used to trigger an other oscilloscope.
|
The Waveform store function saves the measurement data to an SD/MMC card. The format can be ASCII or binary.
|
The pictures on this page were obtained by the ScreenDump function, which operates independently of the menu system. The function saves the screen content to the SD/MMC card in 'bmp' format.
| Top | Last modified: 2017.12.05 |